Determination of Heat of Hydration
Operation
The determination is done
by placing fresh concrete in the Heat-Box and afterwards registers the rise and
decay of the temperature.
The procedure should take
place in a room where the temperature is not changing more than ±
If the initial temperature
of the concrete is lower than the room temperature, then the heat development
will be slightly overestimated. If, for example, the initial temperature of the
concrete is 10 °C (18 °F) lower than the room temperature, temperatures are
overestimated in subsequent simulations by up to approx. 0.2 °C (0.36 °F).
These conditions should be
considered when deciding where to place the Heat-Box.
For acclimatization, the
Heat-Box should be placed in the room 8 hours before operation, with the lid
open.
1. Initialize the datalogger as
described here.
2. Disconnect the datalogger from the
PC.
3. Connect the thermocouple with long
cord to terminal 1 and the other one to terminal 2, on the datalogger.
4. Attach the data logger on the front
plate using the pre-mounted Velcro fastener.
5. Lead the blue cord to the void at the front panel. Fix the cord to avoid squeezing, by means of the tapes.
6. Place the thermocouple inside a brass spear, with its soldering at the closed end.
7. Use a can of the same type as used for
calibration.
8. Place the fresh concrete in the can
and mount the closed end of the brass spear app. at the centre of the can.
9. After the brass spear has been
placed ensure by vibration that the compression of the sample is good.
10. The total weight should be
determined (concrete and can).
Try to perform the next 3 steps as quickly as possible.
It is important to use the start button instead of just using a data logger which already is running. This ensures that the initial time and temperature is correct.
11. Place the can in the Heat-Box by
means of the lifting belt.
12. Press the “Go”-button on the
datalogger until the display shows “Record” after app. 3 seconds.
13. Close the lit of the Heat-Box. Do
not squeeze the cord or the lifting belt.
14. The display of the datalogger is
showing the temperature of the concrete.
15. When the display is showing that the
temperature after reaching maximum has dropped to approx.
16. If the result of the analysis shows that
the hydration process has reached its end, you can finish the measurement. Otherwise,
the measurement must continue for a while, then repeat the analysis.
Analysis of measurement in relation to determination of heat of hydration
Launch the Heat-Box software
from Start-All Programs-Heat-Box Heat-Box.bat.
Select the id-number of the
Heat-Box you want to work with.
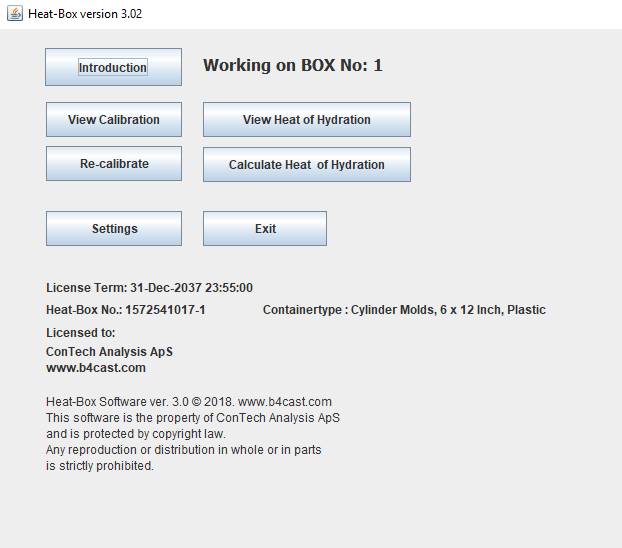
Then the window in figure 7
will appear. Some of the buttons could be dimmed (inactive) until the first
calibration/determination has been performed.
|
|
|
Figure 7 |
Click on the Calculate Heat of Hydration button and the window in figure
8 will appear:
|
|
|
Figure 8 |

Measuring data from the datalogger must be placed on the clipboard as
described here.
In order to load measuring data, go to this.
When measuring data has been loaded, Figure 9:
|
,
|
|
Figure 9 Observed temperatures in sample and in the surroundings |
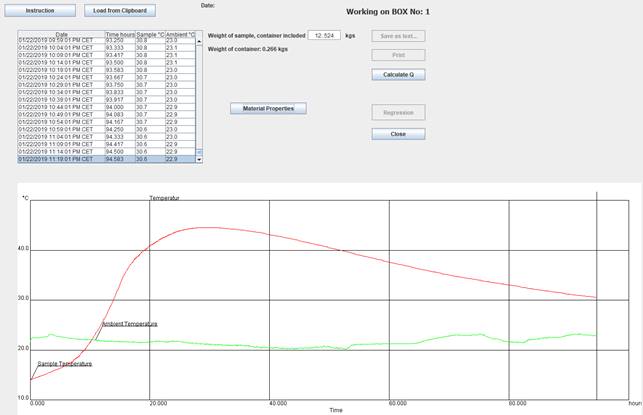
When measuring data has been loaded:
- Fill in the Material Properties and the weight.
- Press the Calculate Q button
- The calculation will last some
minutes. During the calculation is shown how the calculation model is
fitting to the measured data. In addition, the progress of the Heat of
Hydration is shown continuously. See figure 10.
- When the calculation is ended
and you find the compliance between measured and calculated temperatures
being alright, you can save the result. It is possible to present the Heat
of Hydration curve with a linear or logarithmic maturity axis.
ATTENTION!
If the hydration process has reached its end, the Heat of Hydration
(Fig. 10 curve at right) has stopped developing. This is most easily determined
by selecting the linear Maturity-axis. If the Heat of Hydration has not stopped
developing, the measurement must continue for a while, then repeat this
analysis.
- After saving the result, you
will get the opportunity to save the data describing the Heat of Hydration
in a text-file. The datafile is meant to be used as input for thermal
simulation of concrete structures. Alternatively, you can approximate the
data with a model by means of a Regression
Analysis.
Note: The result is Heat development (energy) per weight-unit of cement
or powder content per volume-unit of concrete, as defined in Material Properties.
- Finally, you can print sheets for your archive.
|
|
|
Figure 10 Based on the determined Heat of Hydration (as a function of maturity) in the right figure, is in the left figure shown that the calculated and the observed temperatures are coincident. |
